Pressetjek
Every verdict can be checked.
Pressetjek measures how DR and TV 2, Denmark's two public service broadcasters, cover Danish politics. Every news article since 2020 has been read by a language model with the same instructions, fixed rules in code decide what counts, and every verdict can be traced back to the verbatim quotes in the article. The method, the review and the known limitations are published alongside the figures.
- Role
- Built and run end to end
- Years
- 2026 →
- Live at
- pressetjek.dk
- 137,000+
- articles read and assessed
- 2020
- every article since
- 8
- findings with verdict and figures
- ≈91%
- agreement with blind review
- 21
- topics against official figures
- 426
- journalists measured
Eight findings, each with a verdict and figures.
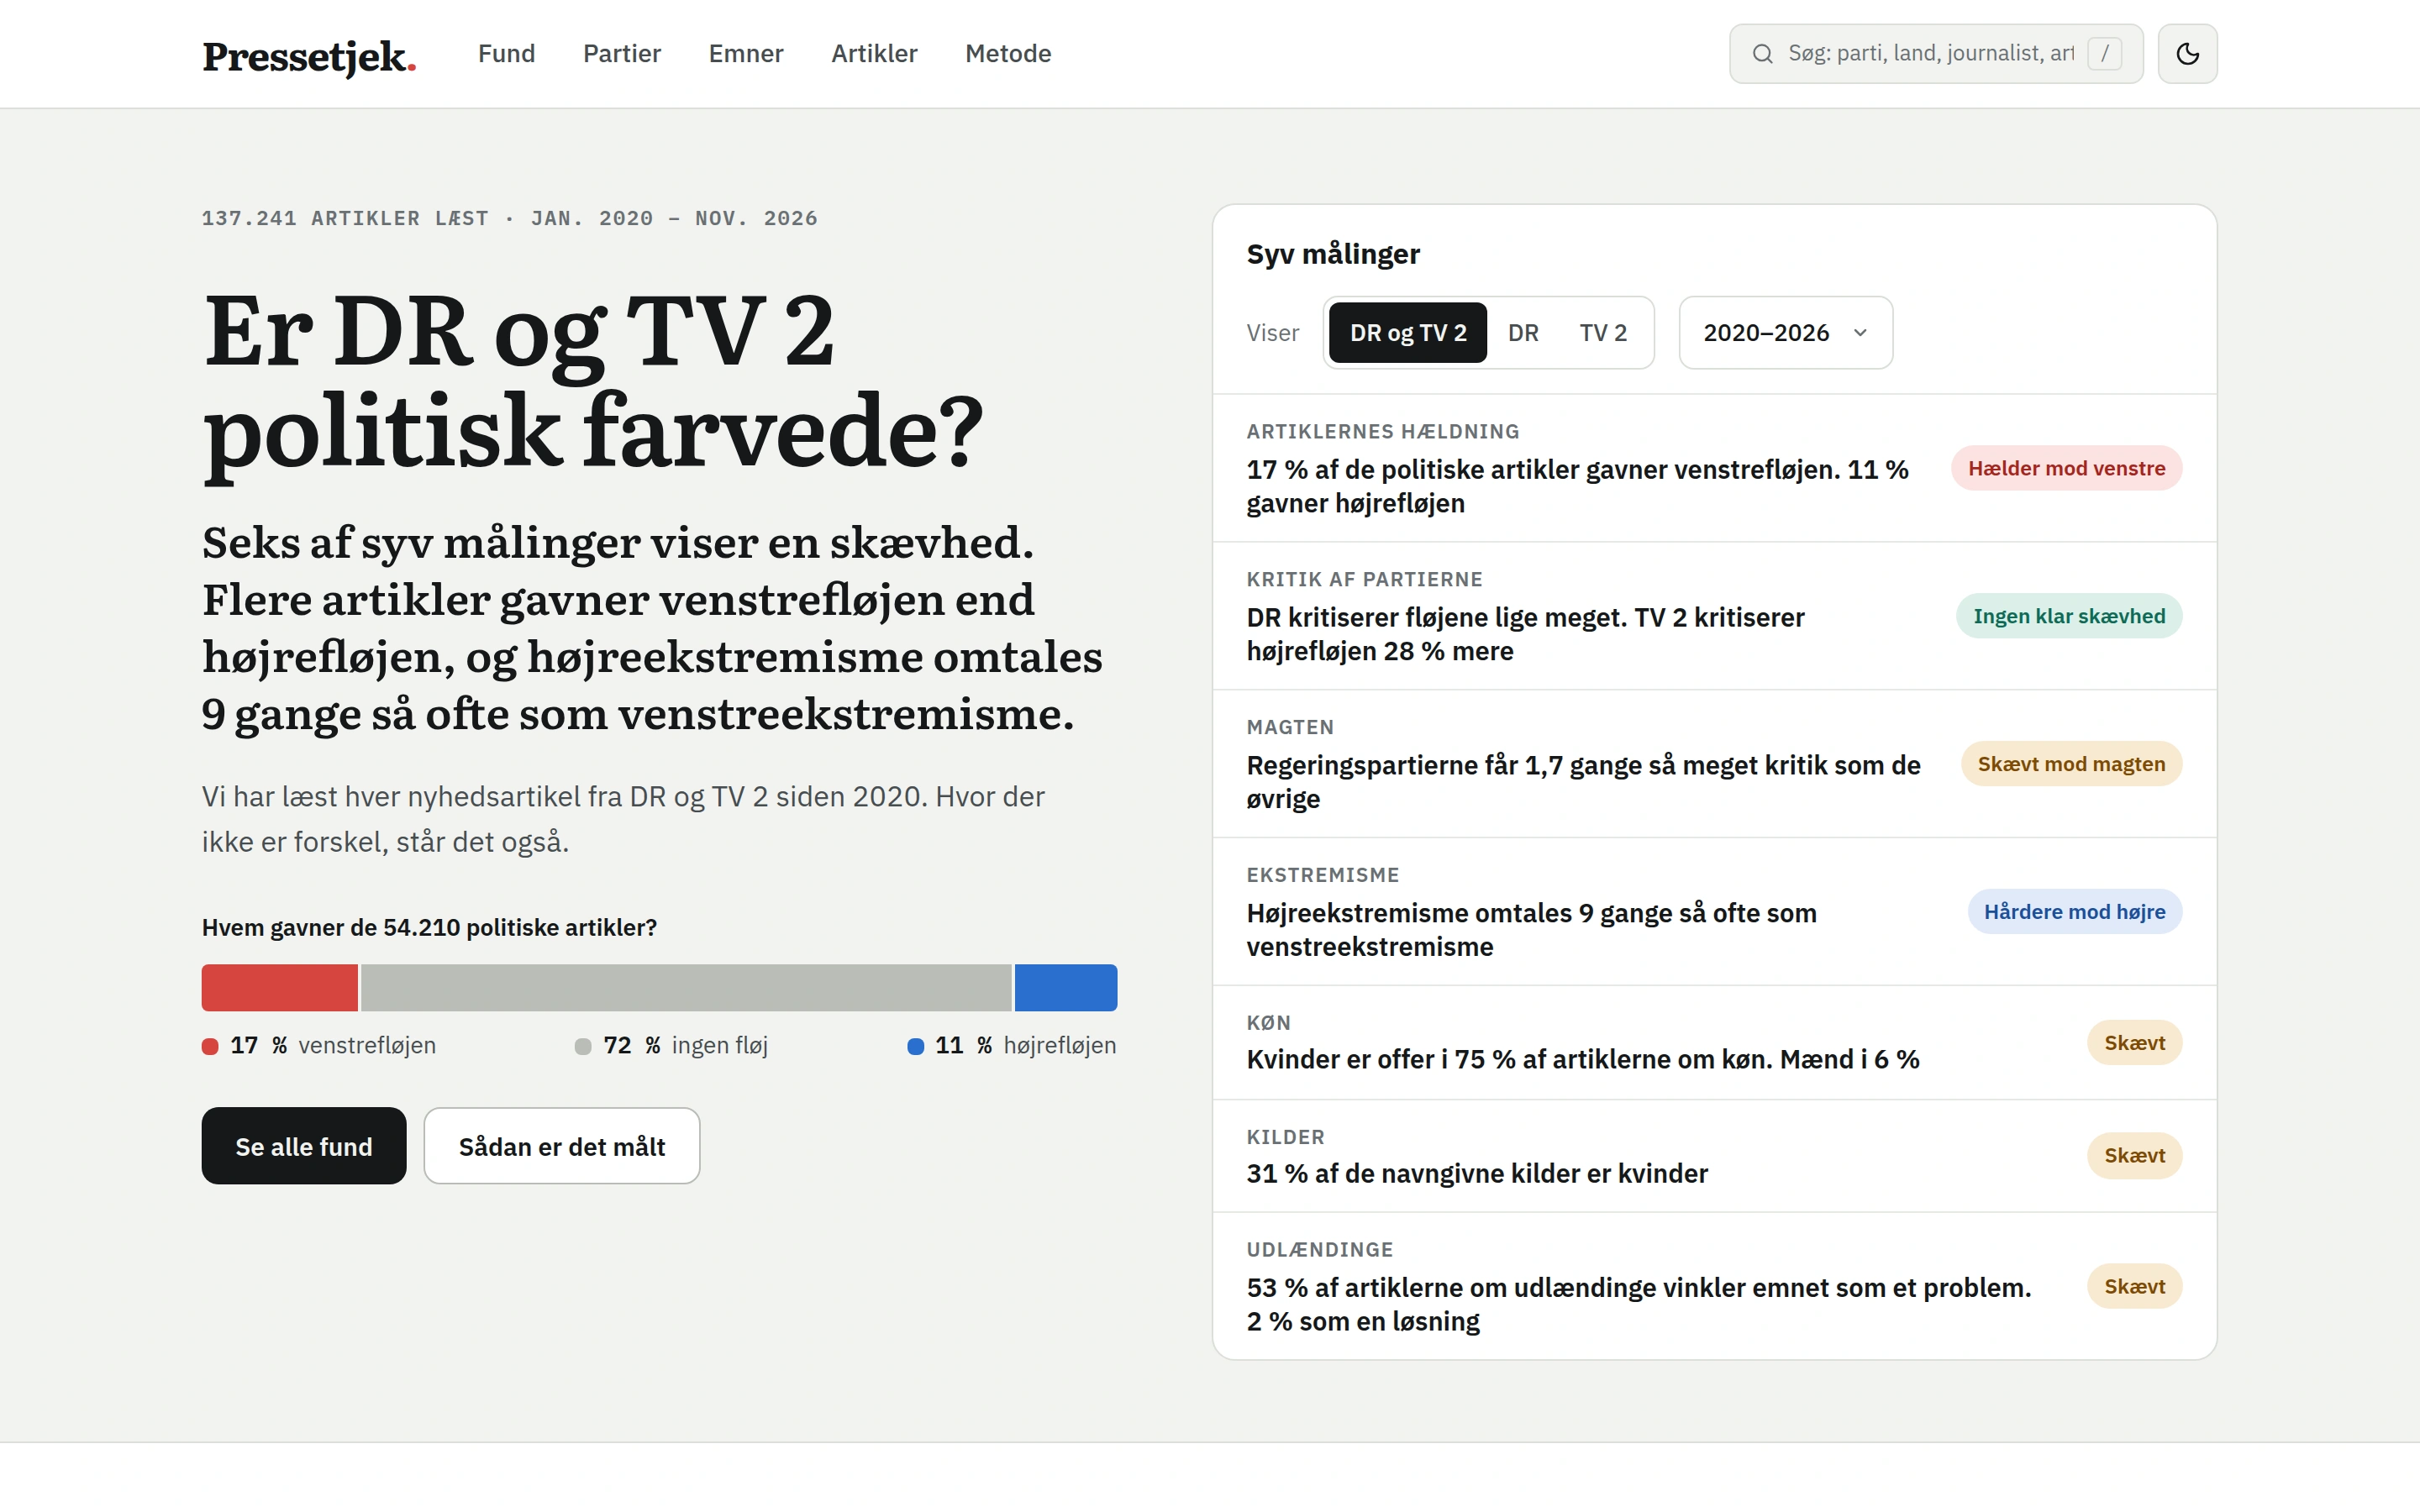
The front page answers one question and shows the measurements behind the answer. Each finding has its own page with the chart, the figures and the articles behind it: the leaning of the articles, criticism of the parties, the government against the other parties, extremism, gender, immigration, climate and wars. Every page can be filtered by broadcaster and year, and where there is no difference, that is stated too.
- Eight findings with a verdict, a one-sentence claim and figures
- Filters for DR, TV 2 and every year since 2020
- A difference is only called a skew when it falls outside the 95% uncertainty
From the figure back to the quote.
Every analysed article has its own page. It shows the verdict on a seven-step scale, the passages that carry the verdict as verbatim quotes, who gets to speak and who criticises whom. The quotes the rules rejected are listed as well, with the reason. Articles can be searched in full text and filtered by broadcaster, topic and journalist.
- One page per article with verdict, reasoning and quotes
- Rejected quotes shown with the reason
- Full-text search across every article
- A link to the original article at DR or TV 2
The model reads. The code decides.
The language model answers the same questions about every article: who appears, how they come across, and which passages put one side in a better or worse light. Which side a passage favours is decided by fixed rules in code instead, so the same rule applies to all 137,000 articles. The sources' own words, plain criticism of those in power and disputes within one bloc do not count.
- The same instructions for every article, whichever broadcaster
- Rules in code rather than judgement in the model
- Instructions tested mirrored: the same wording about the opposite side must give the same answer
- What the rules reject is stored with the reason
Who is criticised, and by whom?
Each of the 12 parties has its own page with criticism and praise per 100 articles, year by year, and the quotes behind them. The figures separate criticism from the journalist, from other parties and from other sources, and show how often the criticism goes unanswered. Two parties can be compared side by side.
- 12 parties, DR and TV 2 shown separately
- Criticism from the journalist kept apart from criticism from sources
- Two parties compared year by year
Coverage held up against the statistics.
For 21 political topics, Pressetjek shows how often the topic is framed as a problem or a solution, next to an official figure for the same period. The figures come from authorities and research institutions such as Statistics Denmark, Europol and the Uppsala Conflict Data Program, and every source is listed on the method page with a link and its caveats.
- 21 topics with framing and an official figure
- Every official source listed with link and caveats
- The trend in the articles and in the figure shown over the same years
Measured twice, with the limitations written down.
200 articles in an independent control set were assessed again by a different language model that did not see the analysis. It agreed with about 91% of the verdicts, and when the same article is analysed again, the leaning points the same way 92% of the time. The known weaknesses are listed on the method page, for example that the model misses roughly every third critical assessment of a party.
- Blind review of 200 articles: ≈91% agreement
- 92% same verdict on repetition
- Known limitations published next to the figures
- Small groups are not shown: parties under 20 mentions, journalists under 25 political articles
The figures are computed before the page opens.
The articles are collected from dr.dk and nyheder.tv2.dk and stored in Postgres at Supabase together with the analysis of each article. The figures are added up in advance per broadcaster, year, party, topic and journalist, so the pages do not compute across 137,000 articles on every visit. Each analysis carries a version, so a new analysis version can be run to completion before it is shown.
- Next.js on Vercel with cached, precomputed figures
- Postgres at Supabase with Danish full-text search
- Versioned analyses: only a finished version is shown
- llms.txt, so AI assistants can find and read the pages
The same approach, for other businesses.
A short description of the work to be automated is enough to start the conversation.
- 01The taskThe recurring work that takes too long.
- 02How it is handled todayWho does it, and with which tools or sources.
- 03How oftenDaily, weekly, or every time a document arrives.
The email button opens a draft with these three prompts in place.